3 Tools Compared for Historical Twitter Keyword Volume
I was putting together a tracking report for a client last week and was looking to get as much historical search volume behind a few keywords on twitter as possible. The goal was to show year on year trends of twitter volume. There were a number of tools that were recommended to me and I wanted to share them along with the pros and cons of each.
One caveat to this type of analysis – twitter has experienced tremendous growth over the last few years, so increases in mentions, keywords, etc may not be related to your social media efforts, much of it may be just be related to the overall growth in twitter.
Here are some twitter tools for measuring volume reviewed, along with the pros and cons of each.
Twadl.com
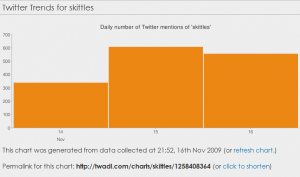
Twadle creates a chart for you that shows you the daily volume of mentions of your keyword over time.
Pros:
- Nice chart
- Simple to use
Cons
- Only goes back 1500 tweets – if you have a popular brand (like skittles) this only gives you a few days worth of data.
- Not enough history
Trendistic.com
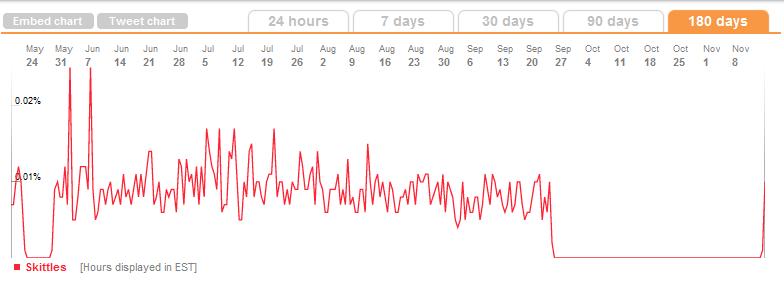
Trendistic.com shows a ton of data (thanks to Noah Coffey @blogindiana for the reco). It is easy to use and shows you the volume of a keyword for 24 hours, 7 days, 30 days 90 days or 180 days (still not long enough to get year on year trends). Despite the lengthy negatives, once this service gets the kinks out it will be really cool.
Pros
- Lots of data
- You can embed the charts
- Shows individual tweets as well (static or dynamic)
- You can tweet the chart directly from the page
Cons
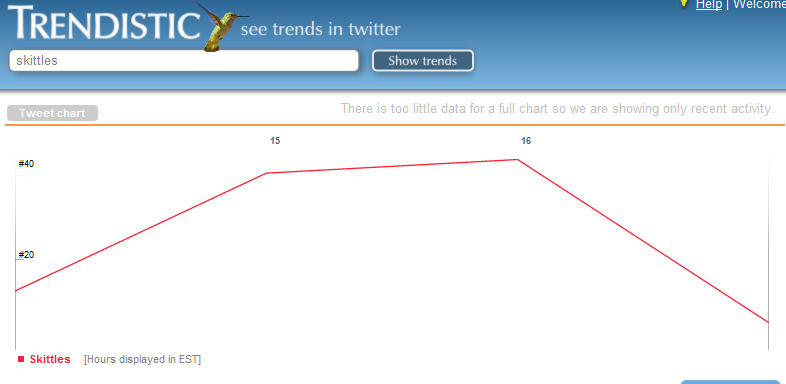
- Data doesn’t seem to be correct (it is in beta). You’ll notice it shows zero for recent days however there are clearly hundreds of tweets mentioning skittles each day.
- The embed option is a script which doesn’t play nice with wordpress – in this blog it showed a large version of the chart that went way off the page – you can pick large or small charts but you can’t customize beyond that.
- If it determines (and I have no idea how) that you don’t have a lot of volume for your term you will be restricted to the. This seems to come up in error – with Skittles it had previously shown the data and then popped up the error message (see below).
Trendistic 180 day data for Skittles
Trendistic Error Message for Skittles
Trendrr.com
Trendrr is a paid for service (although you can do 10 pulls for free) that lets you track trends on multiple social sites. I created a free account for the client I was researching and the twitter feed didn’t pull up (other social networks however did). (Thanks to Erick Osia for sending this site through).
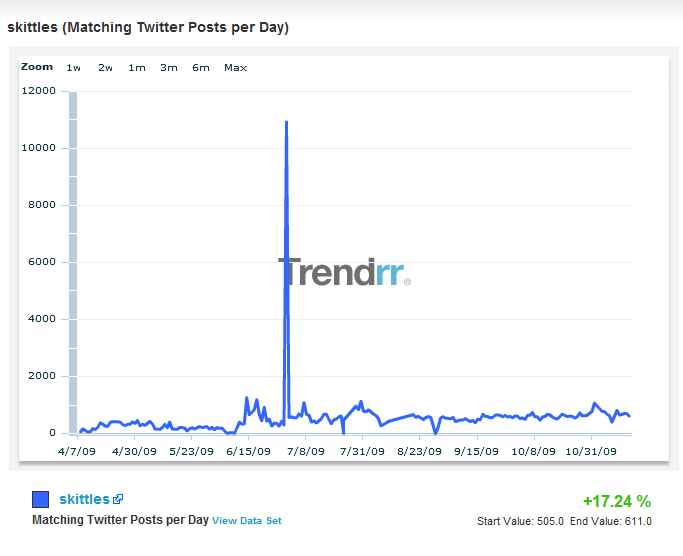
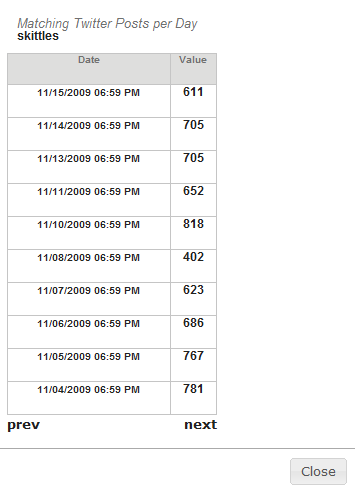
I re-ran it for skittles and got results. You can see in the chart below that you can select a number of time-frames with “max” being about 8 months.
Pros
- Accurate data
- Easy enough to use (although slightly more complex than others)
- Lots of flexibility in time periods
- Can view daily or hourly
- Shows root data also
- More than just twitter
- 8 months of history
Cons
- Have to pay for more than 10 queries
- With client work got no data (not sure why)
